Hello, It's Me
Saurabh Kumar
I'm a Computer Science Engineering graduate who is
passionate in

I'm a Smart working engineering graduate in Computer Science
Engineering specilization in Data Science. Along with my degree, I
completed Python, SQL, Javascript, react, mongoDB and various
technologies. I learnt has helped me develop a project called "Real
time chat application". It was during this project that I discovered
that I am a team player. I am currently seeking roles where I can
utilize my experience and skill.
Accademics & Experience
Python

C Language

HTML
CSS

JavaScript

ReactJS

Node.js

Express.js

Postman
MySQL

MongoDB

Linux

GitHub
VS Code
Powerpoint
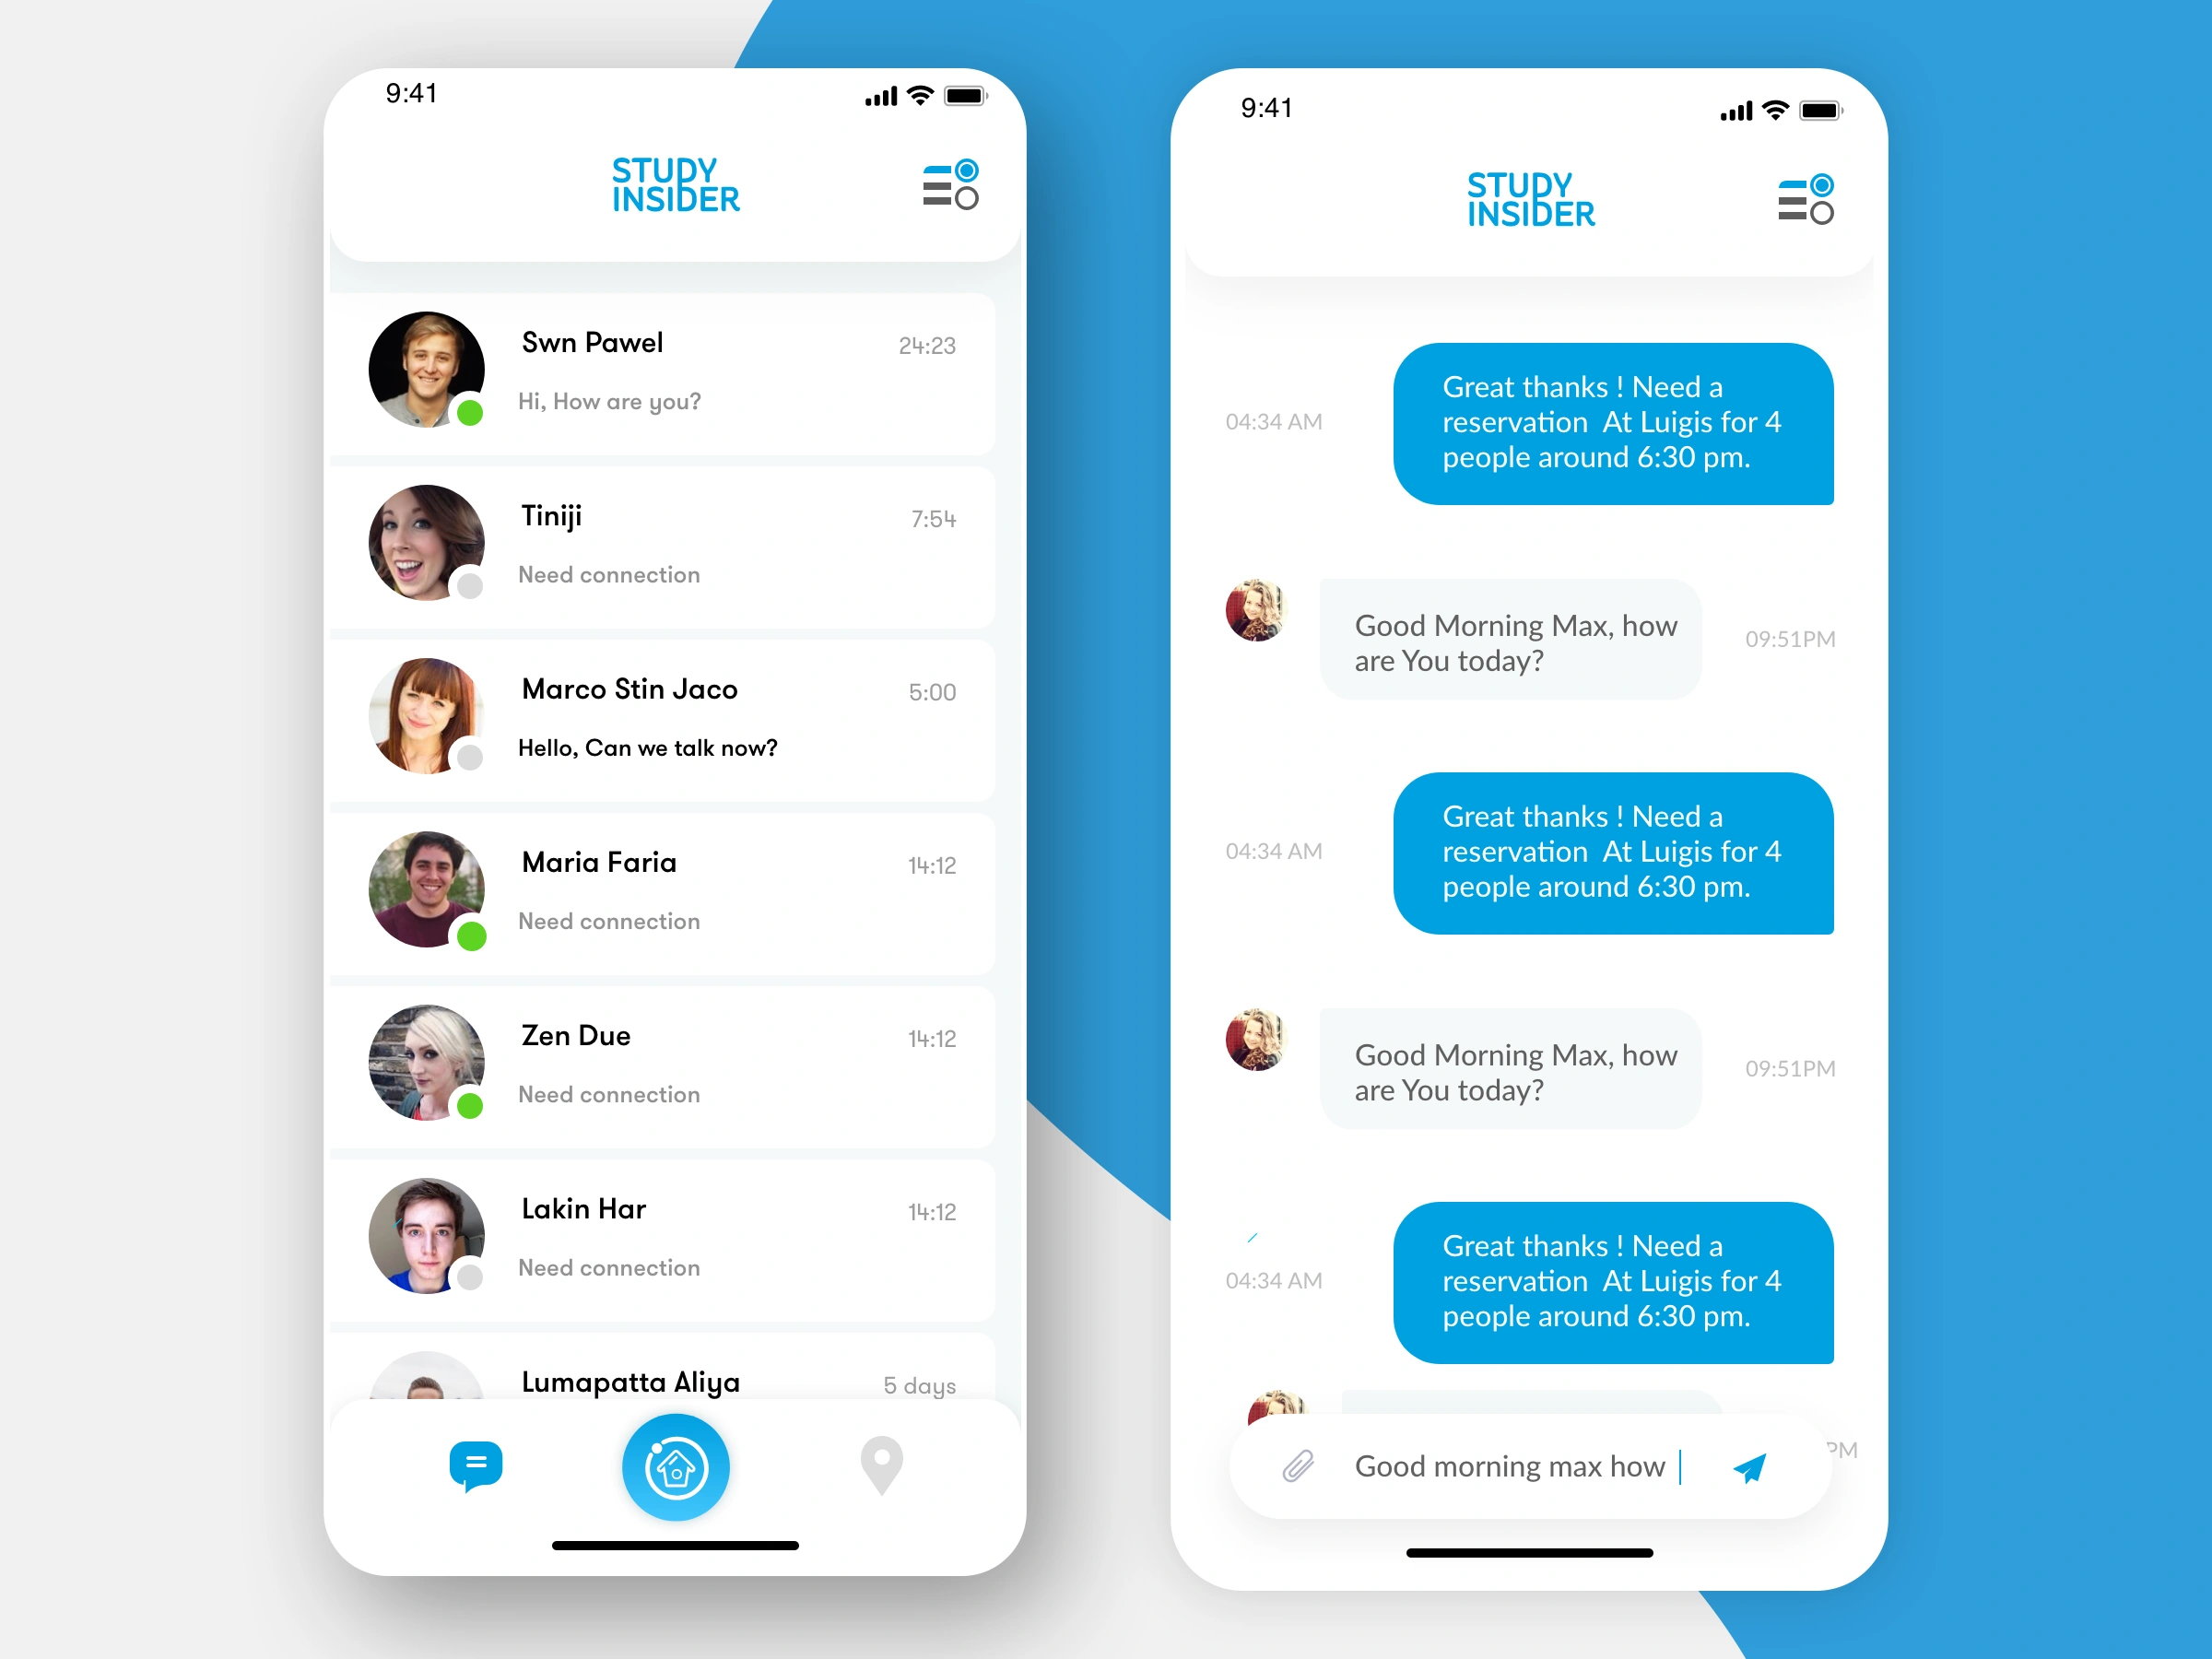
Developed a website enabling to create personalized chat rooms and engage in real-time interactions. Implemented group chat and individual chat functionality, supporting simultaneous messaging for over 50 active users. Developed a Online-Offline user system, ensuring real-time updates. Technologies Used: React, Node.js, MongoDB, React Router DOM, npm, JSON Web Token (JWT), bcrypt.js, Socket.io.
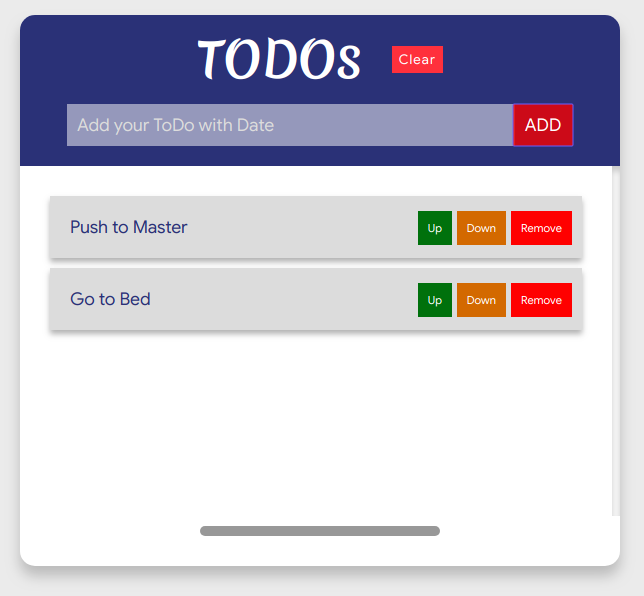
A to-do app is a digital tool designed to help users organize and manage tasks and responsibilities. It typically allows users to create, prioritize, and categorize tasks, set deadlines, and receive reminders. Features often include adding notes, setting recurring tasks, and tracking progress. Technologies Used: React, Node.js, MongoDB, React Router DOM, npm, JSON Web Token (JWT), bcrypt.js, Socket.io.
Conducted data analysis on a Hotel Booking Cancellation dataset, leading to actionable insights on customer behavior and booking cancellation performance. Identified key trends that informed strategic business decisions. and Identify most of the cancellation in which region and which type of peoples booking cancelled most? and also Identify most-booking in the region of the hotel and you can enhance that region where the cancellation rate is high? Technologies Used: Python, NumPy, Pandas, Scikit-learn, matplotlib.
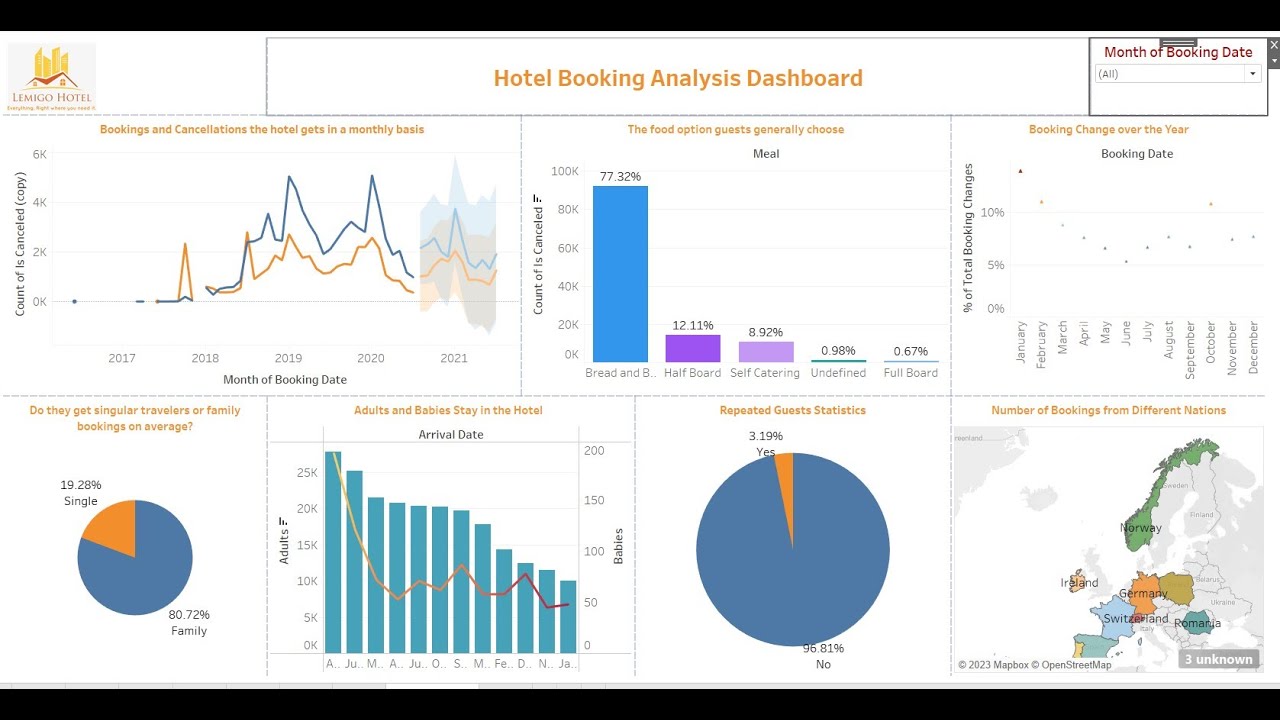
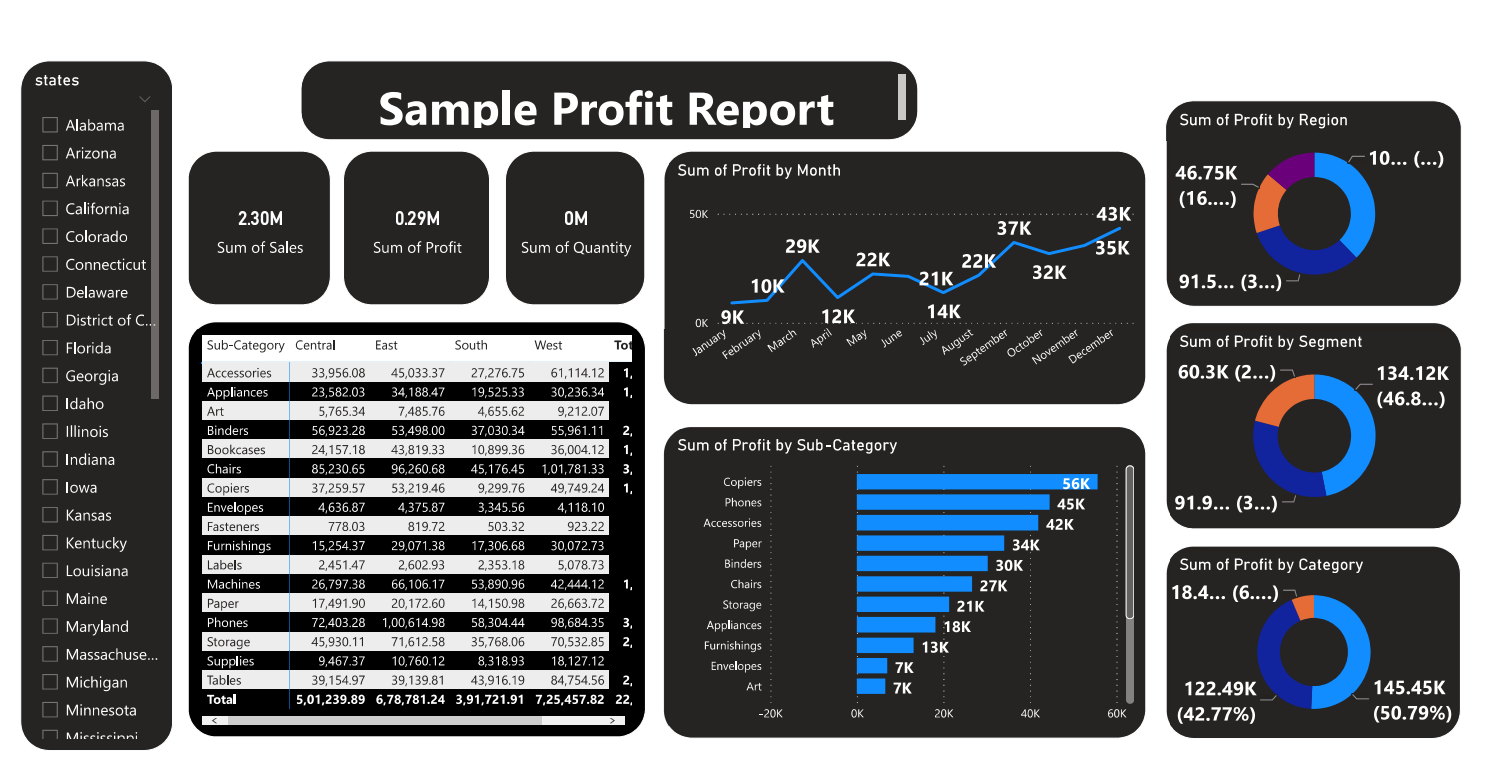
A Power BI dashboard for a profit report is a data visualization tool designed to provide insights into financial performance. These are Common visualizations include bar charts to compare revenue and costs, line graphs for profit trends, and KPIs. Interactive features, such as slicers and drill-through options, allow users to filter by time, department, or product for deeper analysis. The dashboard helps stakeholders quickly assess business performance, identify areas for improvement, and make data-driven decisions to optimize profitability.
Developed by Midhun 2024